HetrixTools (beta), launched in May 2015, was created with the purpose of giving webmasters a useful set of monitoring tools that would improve their efficiency and make their workflow simpler. It does provides Free for life services which are quite usful to monitor the system performance of your servers, although it also can monitor your websites. I did introduced other tools for monitoring websites, such as Freshping, UptimeRobot, Github Project Upptime, etc . After considered HetrixTools's server performance monitor functions, this definitely will be all in one solution for me now.
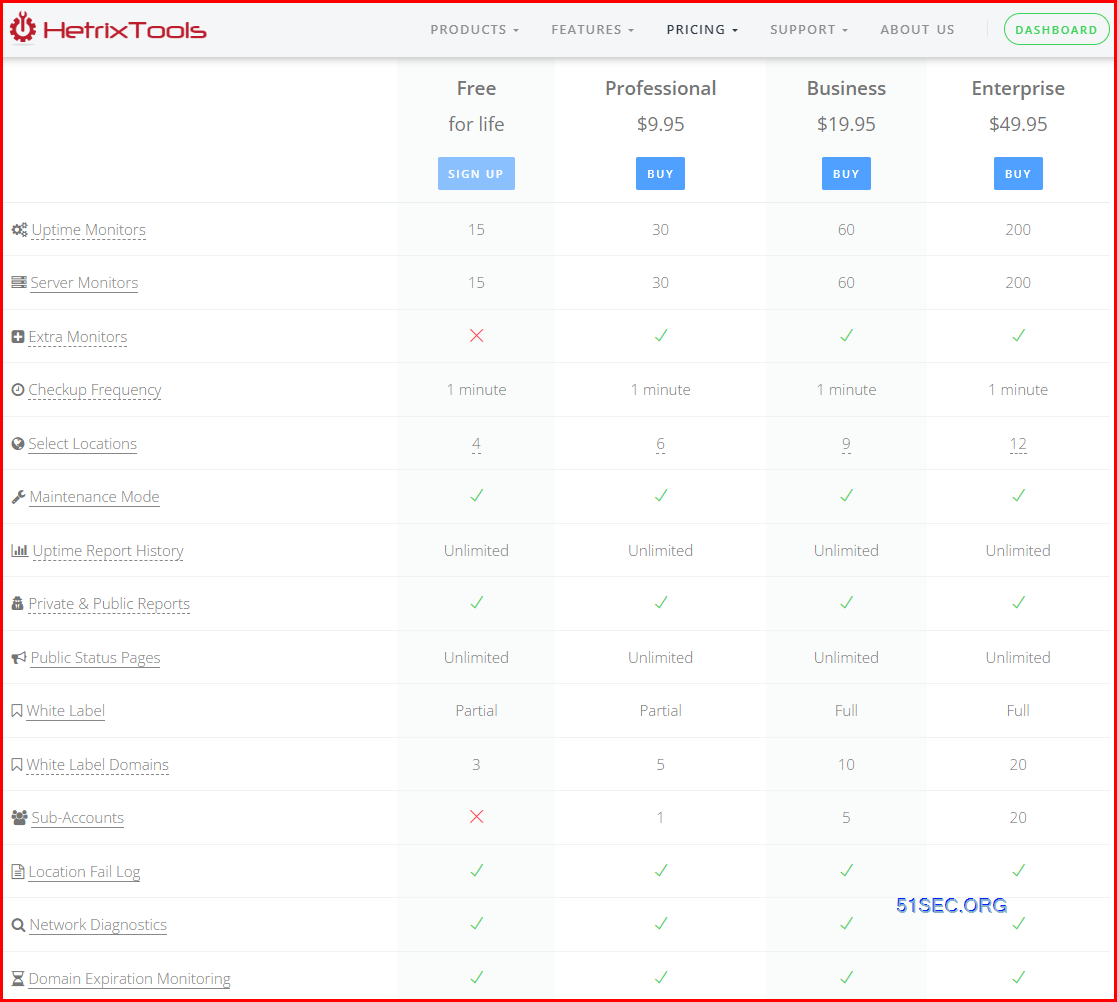
Free for life plan has some limitations such as 15 monitor numbers, four locations to do monitor, but those are not the concerns if you are using it only for your home projects.Features
- Uptime monitor
- Server Monitor (CPU,RAM,Hard Drive, Services, etc)
- Status page
- 12 Monitoring locations
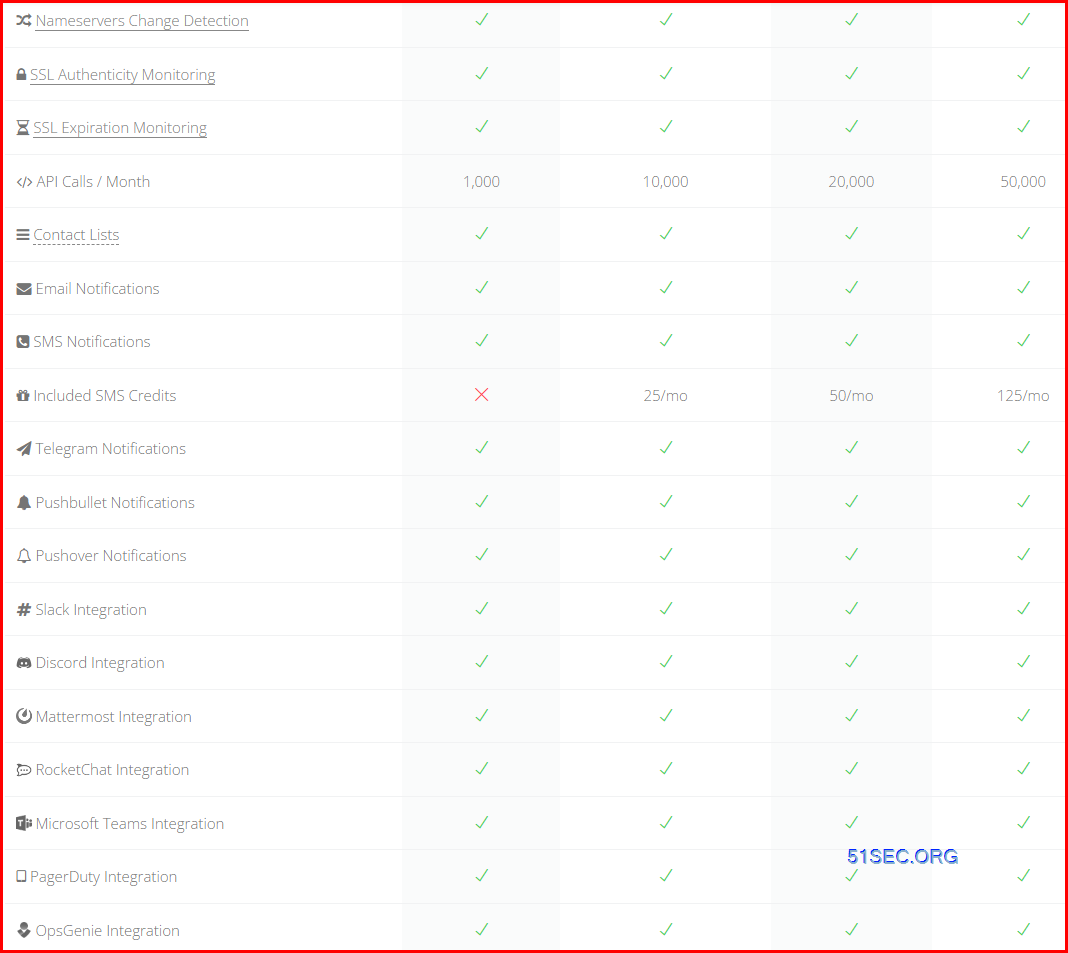
- SSL & Domain expiration monitoring
- Blacklist monitor
- Free for life plan
- 15 Monitors for Uptime & Servers
- 1 minute checkup frequency
- 3 Custom Domain (White Label Domains)
- Uptime Report History - unlimited
- Private & Public Reports
- Unlimited Public Status Pages
- Contact list support email, sms, and many popular communication integrations
Add Website To Uptime Monitor
1 Register an account (No Credit Card Required)
2 Add Monitor from Dashboard's Uptime Monitors page
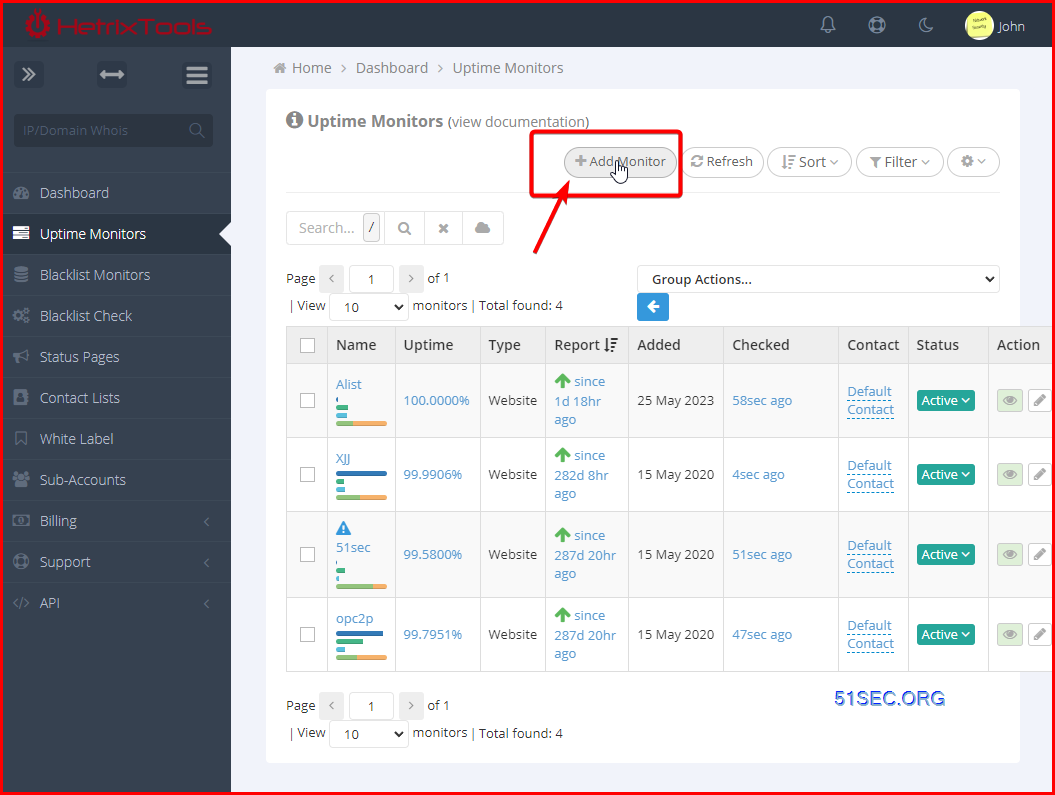
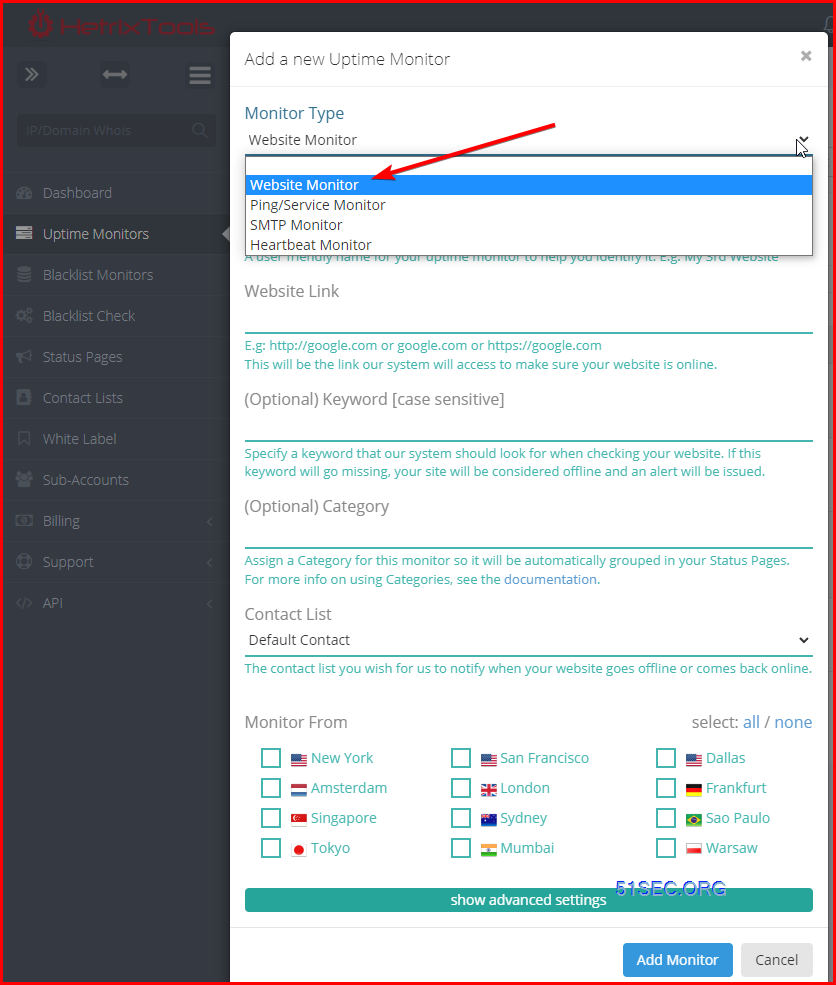
3 Choose Website Monitor as Monitor Type.
4 Result

Enable Server Monitoring
1 Click Config Icon to have a pull-down menu

2 choose Install Monitoring Agent
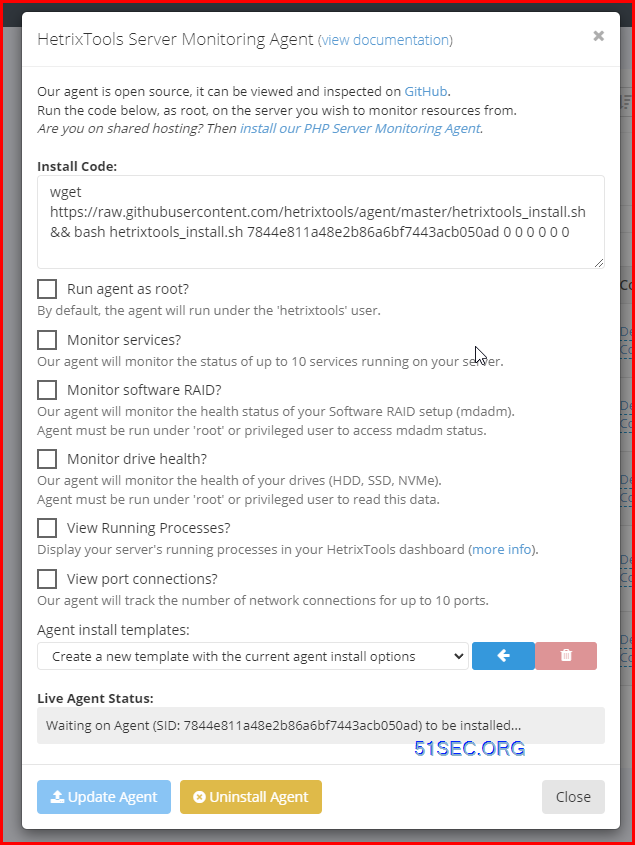
3 Copy the generated code to your Linux server to run
Code
wget https://raw.githubusercontent.com/hetrixtools/agent/master/hetrixtools_install.sh && bash hetrixtools_install.sh 7844e811a48e2b86a6bf7443acb050ad 0 0 0 0 0 0
In this way, HetrixTools will not collect your server performance data from your server.
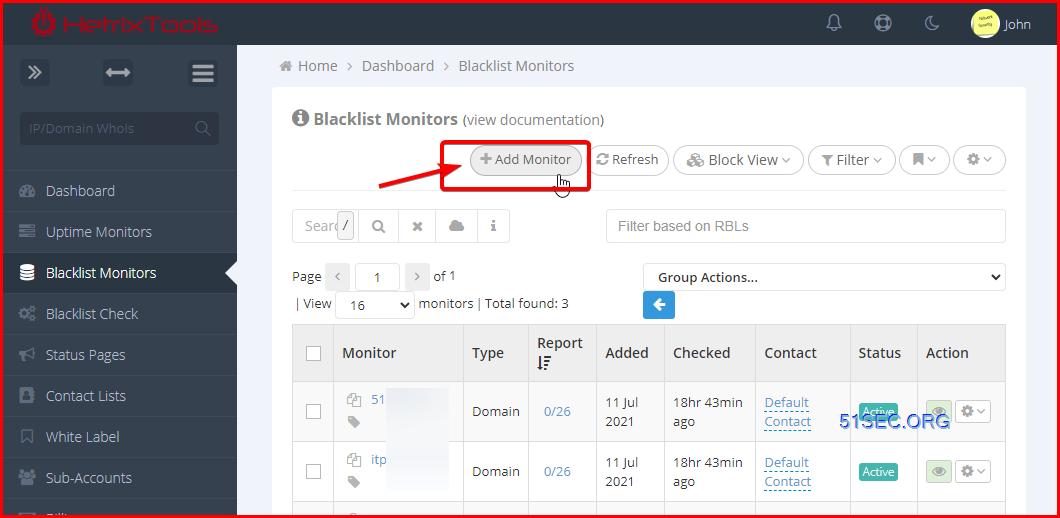
Add A Blacklist Monitors
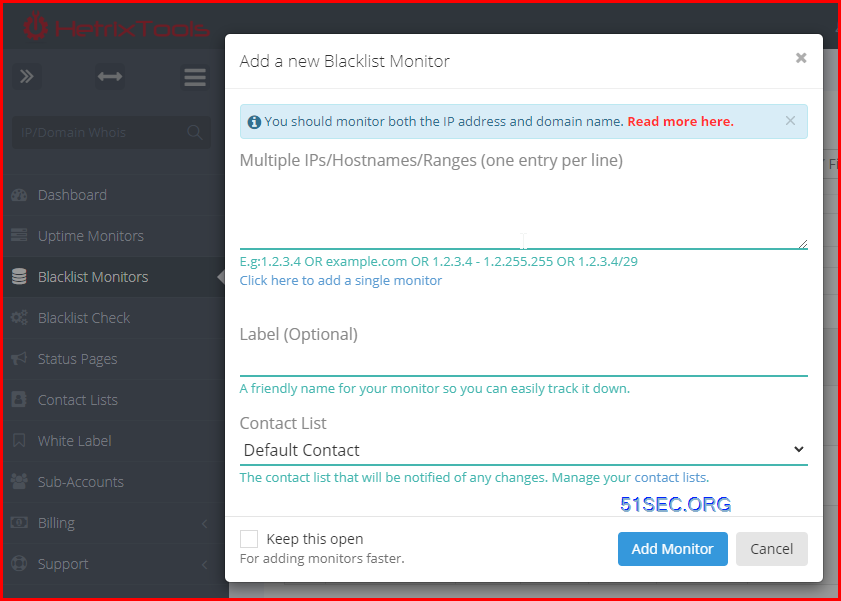
1 Add a new monitor in Blacklist Monitors
2 Add multiple IPs / Hostnames / Ranges into configuraiton page
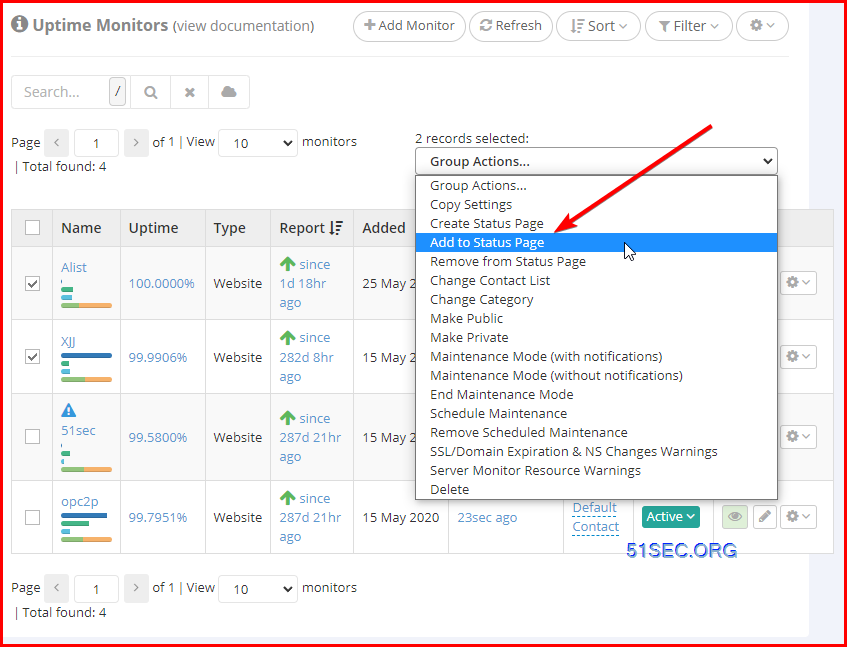
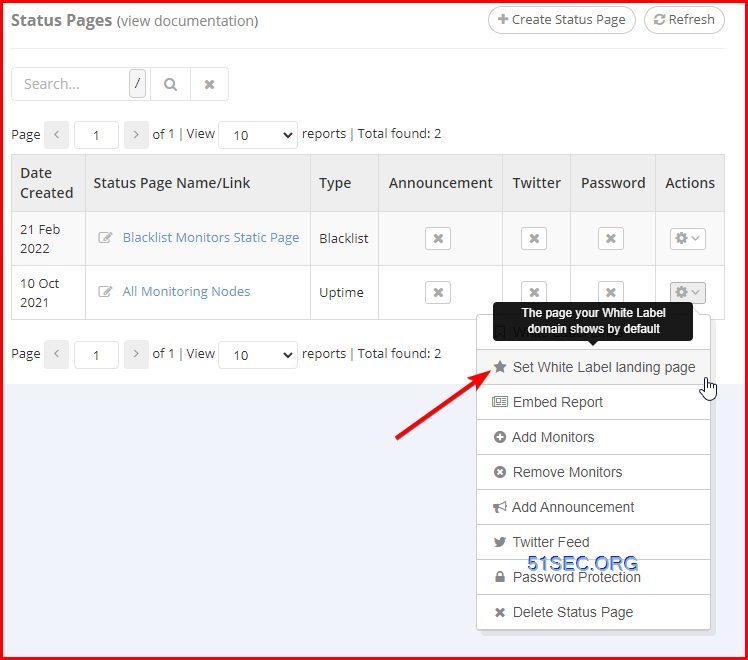
Status Page
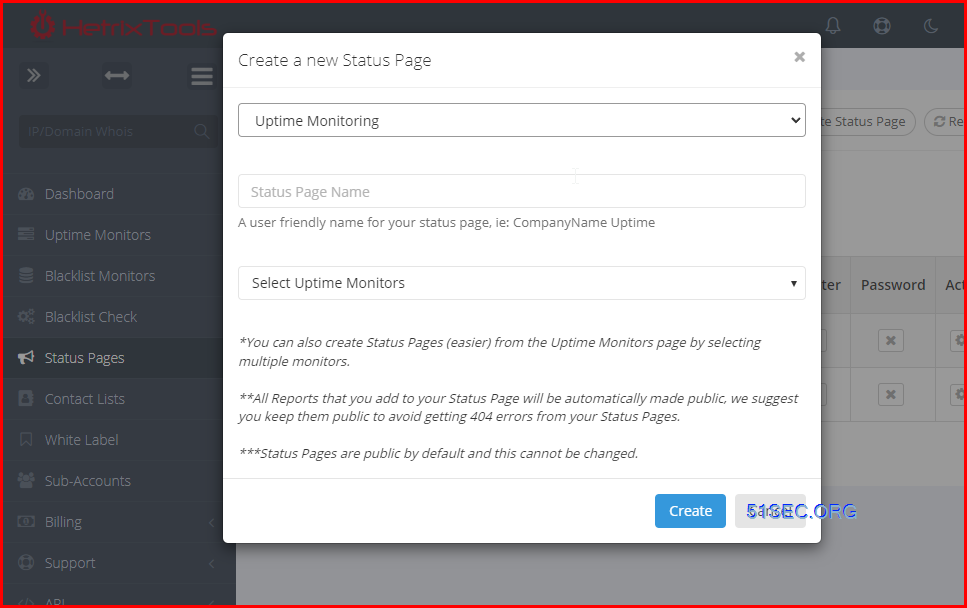
2 Add multiple monitors into your new created status page
3 Status Page with your unique URL

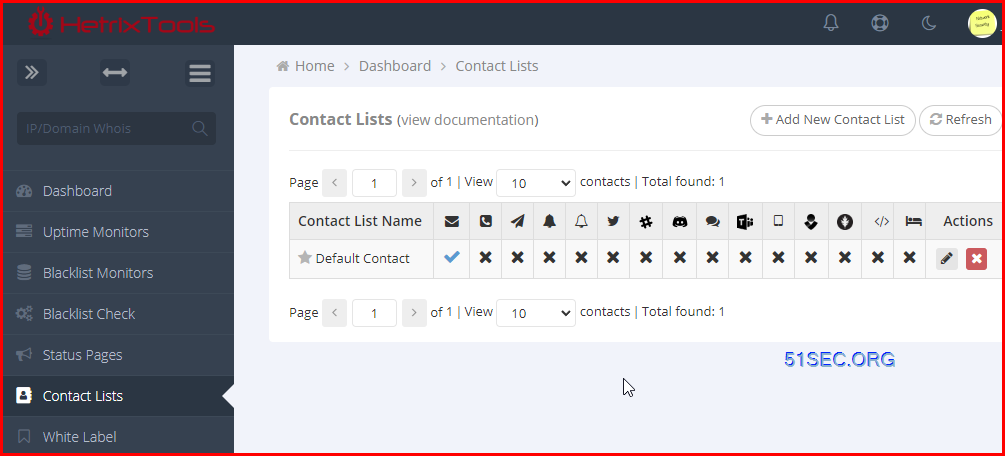
Create Contact List for Alerting
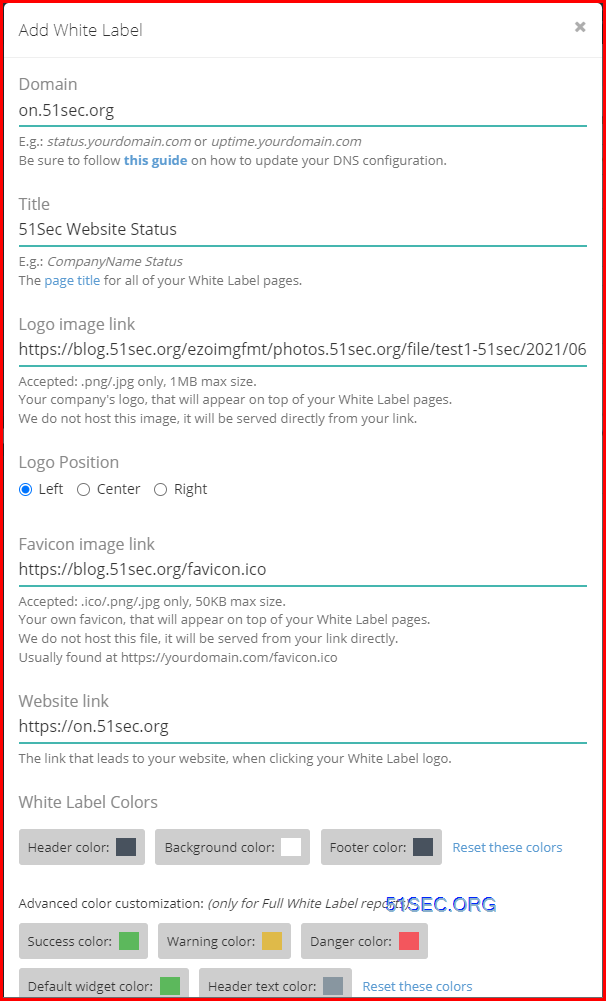
Add your own domain for your status page
The following general steps should apply to most DNS management platforms:- Log into your DNS management console (usually provided by your domain registrar, or third party providers such as CloudFlare if you’ve moved your nameservers there).
- Locate the area where you can change or add DNS records
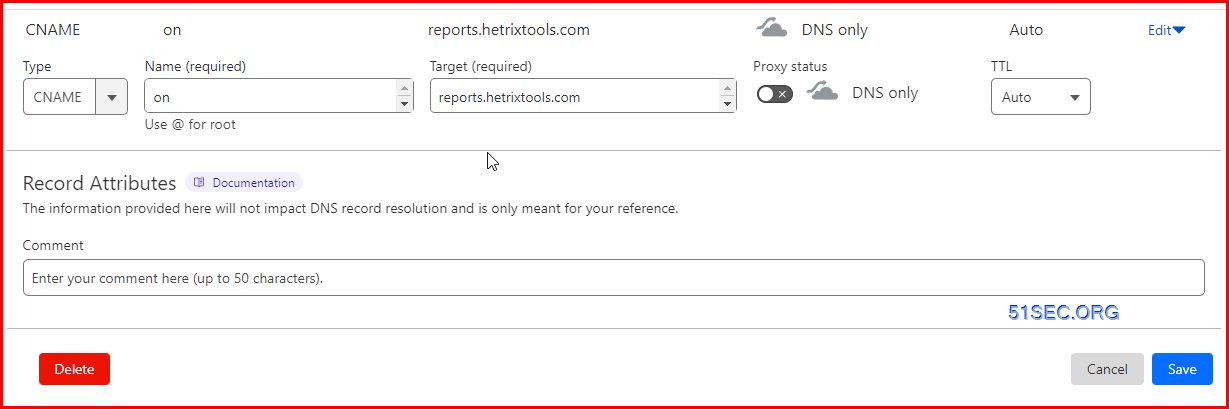
- Create a new DNS record with the following attributes/values:
- Type: CNAME
- Name/Alias: your desired name, for instance if you want your White Label Domain to be status.your-domain.com then use ‘status‘ (without quotes) as your name/alias.
- Points to: reports.hetrixtools.com
- IMPORTANT: if you’re setting this up on CloudFlare, be sure to select the gray cloud next to this DNS record (more info)
- Optional: in some (older) DNS management consoles, you are required to add an ending dot after “reports.hetrixtools.com”, so make sure to watch out for that if you encounter any errors while adding the new DNS record.
- Save your DNS changes
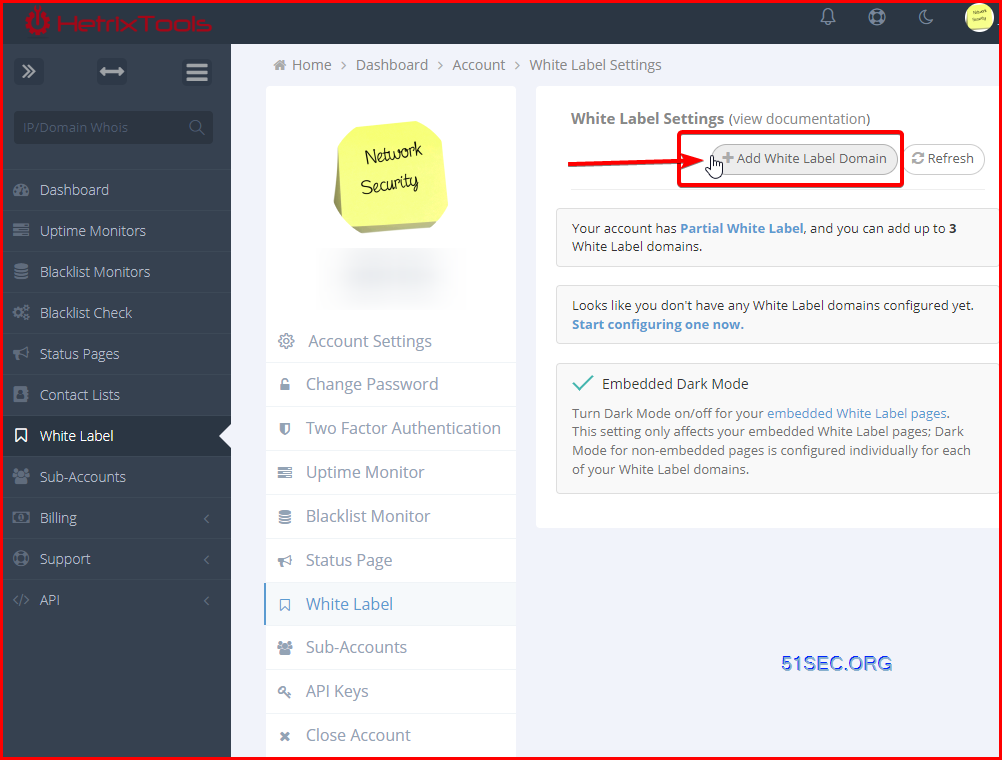
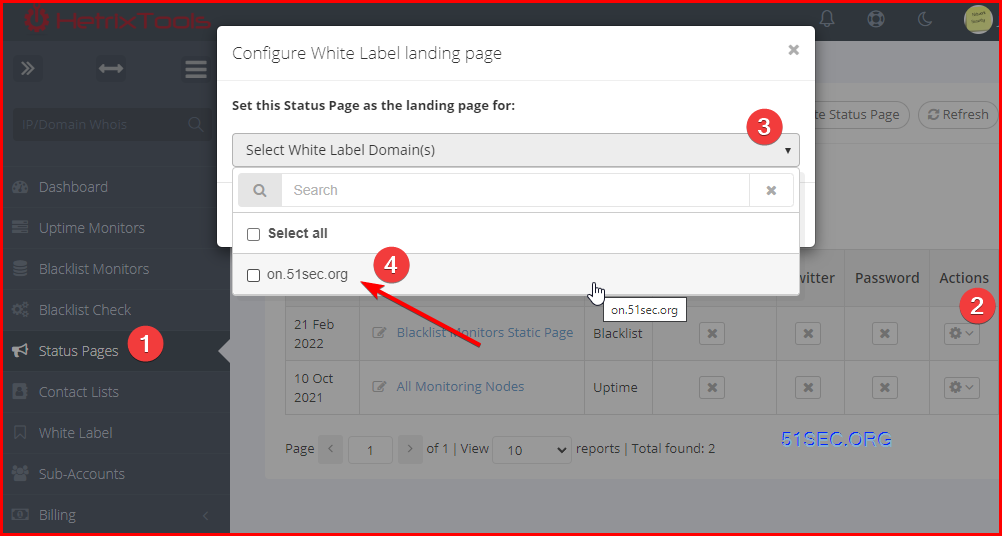
2 Add a white label domain into HetrixTools


No comments:
Post a Comment